Graph
Do you need to plot your values in some automatic way? Here's a customizable snippet for creating your own 2D graphs.
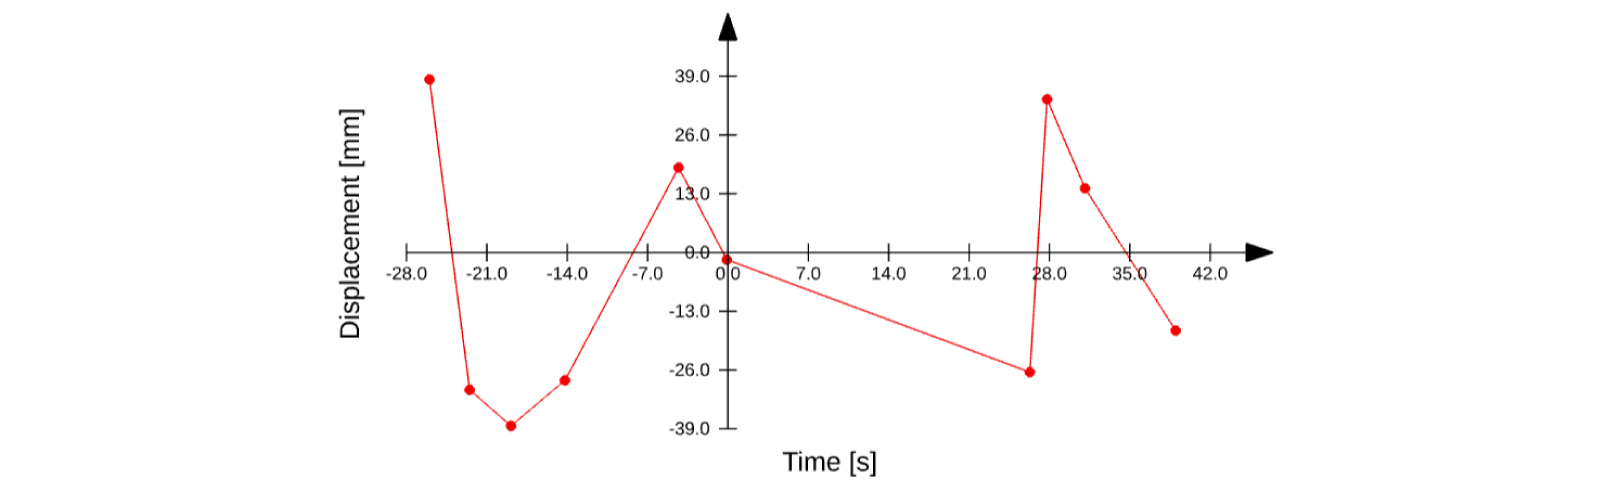
Function
The code below generates a 2D graph as layout, with the following inputs:
valuesas a non-sorted list ofSKYMATH.Vector2Dto plot.- and these optional arguments:
graphTypeto switch betweenlinearorscatterappearance.xLabel&yLabelfor the titles of each axis.nrDivisionsas the number of divisions for each axis in aSKYMATH.Vector2D.decimalsas the number of decimals in the divisions for each axis in aSKYMATH.Vector2D.validStepSizesas a list ofnumberfor step sizes that the axis divisions can have.valuesColoras the color of the values to plot.textSizefor the axis divisions.labelTextSizefor the labels.graphSizeas the visual size of the graph.
export function generateGraphLayout(
  values: SKYMATH.Vector2D[],
  {
    graphType = 'scatter' as 'linear' | 'scatter',
    xLabel = 'Time [s]',
    yLabel = 'Displacement [mm]',
    nrDivisions = new SKYMATH.Vector2D(11, 7),
    decimals = new SKYMATH.Vector2D(1, 1),
    validStepSizes = [0.1, 0.2, 0.5, 1, 1.5, 2, 3, 4, 5, 6, 7, 8, 9, 10],
    valuesColor = 0xff0000, // can also be "new SKYCAD.RgbColor(255, 0, 0)"
    textSize = 2,
    labelTextSize = 3,
    graphSize = new SKYMATH.Vector2D(100, 50),
  } = {},
) {
  const AXIS_MARGIN = 4
  const ARROW_SIZE = new SKYMATH.Vector2D(2, 3)
  const layout = new SKYCAD.Layout()

  // #region Step size & Axis placement
  let minX = Math.min(...values.map((p) => p.x))
  let maxX = Math.max(...values.map((p) => p.x))
  let minY = Math.min(...values.map((p) => p.y))
  let maxY = Math.max(...values.map((p) => p.y))

  if (minX === maxX) {
    minX -= 1
    maxX += 1
  }
  if (minY === maxY) {
    minY -= 1
    maxY += 1
  }

  const availableWidth = graphSize.x - 2 * AXIS_MARGIN - ARROW_SIZE.y
  const availableHeight = graphSize.y - 2 * AXIS_MARGIN - ARROW_SIZE.y

  let stepSizeX =
    validStepSizes.find((s) => s >= (maxX - minX) / (nrDivisions.x - 1)) || (maxX - minX) / (nrDivisions.x - 1)
  let stepSizeY =
    validStepSizes.find((s) => s >= (maxY - minY) / (nrDivisions.y - 1)) || (maxY - minY) / (nrDivisions.y - 1)

  const axisMinX = Math.floor(minX / stepSizeX) * stepSizeX
  const axisMaxX = axisMinX + stepSizeX * (nrDivisions.x - 1)
  const axisMinY = Math.floor(minY / stepSizeY) * stepSizeY
  const axisMaxY = axisMinY + stepSizeY * (nrDivisions.y - 1)

  const visualScaleX = availableWidth / (axisMaxX - axisMinX)
  const visualScaleY = availableHeight / (axisMaxY - axisMinY)

  const hasZeroX = axisMinX <= 0 && axisMaxX >= 0
  const hasZeroY = axisMinY <= 0 && axisMaxY >= 0

  const originX = hasZeroX
    ? -axisMinX * visualScaleX + AXIS_MARGIN
    : axisMaxX <= 0
      ? AXIS_MARGIN + (nrDivisions.x - 1) * stepSizeX * visualScaleX
      : AXIS_MARGIN

  const originY = hasZeroY
    ? -axisMinY * visualScaleY + AXIS_MARGIN
    : axisMaxY <= 0
      ? AXIS_MARGIN + (nrDivisions.y - 1) * stepSizeY * visualScaleY
      : AXIS_MARGIN
  // #endregion

  // #region Values
  const sortedValues = values.slice().sort((a, b) => a.x - b.x)
  switch (graphType) {
    case 'scatter':
      sortedValues.forEach(({ x, y }) => {
        const px = (x - axisMinX) * visualScaleX + AXIS_MARGIN
        const py = (y - axisMinY) * visualScaleY + AXIS_MARGIN
        layout.addSketch(SKYCAD.generateCircleSketch(px, py, 1), {
          fillColor: valuesColor,
          lineColor: valuesColor,
        })
      })
      break
    case 'linear': {
      const functionSketch = new SKYCAD.Sketch()
      sortedValues.forEach(({ x, y }, index) => {
        const px = (x - axisMinX) * visualScaleX + AXIS_MARGIN
        const py = (y - axisMinY) * visualScaleY + AXIS_MARGIN
        if (index === 0) functionSketch.moveTo(px, py)
        else functionSketch.lineTo(px, py)
      })
      layout.addSketch(functionSketch, { lineColor: valuesColor })
      break
    }
  }
  // #endregion

  // #region X-axis
  const xAxisSketch = new SKYCAD.Sketch()
  xAxisSketch.moveTo(AXIS_MARGIN, originY)
  xAxisSketch.lineTo(graphSize.x - ARROW_SIZE.y, originY)
  xAxisSketch.lineTo(graphSize.x - ARROW_SIZE.y, originY + 0.5 * ARROW_SIZE.x)
  xAxisSketch.lineTo(graphSize.x, originY)
  xAxisSketch.lineTo(graphSize.x - ARROW_SIZE.y, originY - 0.5 * ARROW_SIZE.x)
  xAxisSketch.lineTo(graphSize.x - ARROW_SIZE.y, originY)

  for (let i = 0; i < nrDivisions.x; i++) {
    const xValue = axisMinX + i * stepSizeX
    layout.addLayout(
      getDivisionLayout(xValue, {
        orientation: 'vertical',
        decimals: decimals.x,
        textSize,
      }),
      {
        position: new SKYMATH.Vector2D((xValue - axisMinX) * visualScaleX + AXIS_MARGIN, originY),
        rotation: Math.PI / 2,
      },
    )
  }
  layout.addSketch(xAxisSketch, { fillColor: 0x000000 })
  // #endregion

  // #region Y-axis
  const yAxisSketch = new SKYCAD.Sketch()
  yAxisSketch.moveTo(originX, AXIS_MARGIN)
  yAxisSketch.lineTo(originX, graphSize.y - ARROW_SIZE.y)
  yAxisSketch.lineTo(originX + 0.5 * ARROW_SIZE.x, graphSize.y - ARROW_SIZE.y)
  yAxisSketch.lineTo(originX, graphSize.y)
  yAxisSketch.lineTo(originX - 0.5 * ARROW_SIZE.x, graphSize.y - ARROW_SIZE.y)
  yAxisSketch.lineTo(originX, graphSize.y - ARROW_SIZE.y)

  for (let i = 0; i < nrDivisions.y; i++) {
    const yValue = axisMinY + i * stepSizeY
    layout.addLayout(
      getDivisionLayout(yValue, {
        orientation: 'horizontal',
        decimals: decimals.y,
        textSize,
      }),
      {
        position: new SKYMATH.Vector2D(originX, (yValue - axisMinY) * visualScaleY + AXIS_MARGIN),
      },
    )
  }
  layout.addSketch(yAxisSketch, { fillColor: 0x000000 })
  // #endregion

  // #region Labels
  const layoutBounds = layout.getBounds()
  layout.addText(xLabel, {
    position: new SKYMATH.Vector2D(
      layoutBounds.min.x + (layoutBounds.max.x - layoutBounds.min.x) / 2,
      layoutBounds.min.y - 1.33 * labelTextSize,
    ),
    size: labelTextSize,
    align: 'center',
  })
  layout.addText(yLabel, {
    position: new SKYMATH.Vector2D(
      layoutBounds.min.x - labelTextSize,
      layoutBounds.min.y + (layoutBounds.max.y - layoutBounds.min.y) / 2,
    ),
    size: labelTextSize,
    align: 'center',
    rotation: Math.PI / 2,
  })
  // #endregion

  return layout

  function getDivisionLayout(value: number, { size = 2, orientation = 'vertical', textSize = 2, decimals = 1 } = {}) {
    const isVertical = orientation === 'vertical'
    const layout = new SKYCAD.Layout()
    const valueSketch = new SKYCAD.Sketch()
    valueSketch.moveTo(-0.5 * size, 0)
    valueSketch.lineTo(0.5 * size, 0)
    layout.addSketch(valueSketch)
    layout.addText(`${value.toFixed(decimals)}`, {
      position: new SKYMATH.Vector2D(
        -0.5 * size + (isVertical ? -textSize : -0.5 * textSize),
        isVertical ? 0 : -0.33 * textSize,
      ),
      align: isVertical ? 'center' : 'right',
      size: textSize,
      rotation: isVertical ? -Math.PI / 2 : 0,
    })
    return layout
  }
}
Examples
- Values with +x and +y:

const values = [
  new SKYMATH.Vector2D(30.1, 6),
  new SKYMATH.Vector2D(41.4, 11.3),
  new SKYMATH.Vector2D(24.1, 33.8),
  new SKYMATH.Vector2D(49.4, 1.2),
  new SKYMATH.Vector2D(18.7, 14.8),
  new SKYMATH.Vector2D(0.5, 23.8),
  new SKYMATH.Vector2D(37.2, 47.4),
  new SKYMATH.Vector2D(43.8, 37.1),
  new SKYMATH.Vector2D(11.3, 17.2),
  new SKYMATH.Vector2D(22.5, 31.2),
]
const graphLayout = GEOM2D.generateGraphLayout(values)
- Values with -x and -y:

const values = [
  new SKYMATH.Vector2D(-5.1, -5.2),
  new SKYMATH.Vector2D(-2.4, -3.5),
  new SKYMATH.Vector2D(-7.3, -1.4),
  new SKYMATH.Vector2D(-5, -4.4),
  new SKYMATH.Vector2D(-3.3, -1),
  new SKYMATH.Vector2D(-3.6, -2.1),
  new SKYMATH.Vector2D(-9.4, -3.9),
  new SKYMATH.Vector2D(-1.5, -3.5),
  new SKYMATH.Vector2D(-7, -0.5),
  new SKYMATH.Vector2D(-0.7, -3.2),
]
const graphLayout = GEOM2D.generateGraphLayout(values)
- Values with ±x and +y:

const values = [
  new SKYMATH.Vector2D(-0.5, 7.1),
  new SKYMATH.Vector2D(-8.8, 8.8),
  new SKYMATH.Vector2D(6.8, 7.9),
  new SKYMATH.Vector2D(-5.6, 1.9),
  new SKYMATH.Vector2D(-1.8, 4.6),
  new SKYMATH.Vector2D(4.7, 6.4),
  new SKYMATH.Vector2D(1.8, 8.2),
  new SKYMATH.Vector2D(4.3, 5.3),
  new SKYMATH.Vector2D(-5.3, 3.3),
  new SKYMATH.Vector2D(8, 6),
]
const graphLayout = GEOM2D.generateGraphLayout(values)
- Values with +x and ±y:

const values = [
  new SKYMATH.Vector2D(39.4, -19.8),
  new SKYMATH.Vector2D(27, -36.9),
  new SKYMATH.Vector2D(25.5, -0.5),
  new SKYMATH.Vector2D(33.2, -19.4),
  new SKYMATH.Vector2D(7.1, -2.2),
  new SKYMATH.Vector2D(10, -29.8),
  new SKYMATH.Vector2D(30.9, 20.5),
  new SKYMATH.Vector2D(40.9, -2.3),
  new SKYMATH.Vector2D(34.1, 31.3),
  new SKYMATH.Vector2D(41.4, 37),
]
const graphLayout = GEOM2D.generateGraphLayout(values)
- 1 single value:

const values = [new SKYMATH.Vector2D(57, 102)]
const graphLayout = GEOM2D.generateGraphLayout(values)