SKYDRAWING
This library handles exportable drawings like PDF or DXF.
Drawing
Drawings are defined as a collection of pages containing layouts. Create a drawing as:
const drawing = new SKYDRAWING.Drawing()
You can set default properties that apply to all pages added with:
const drawing = new SKYDRAWING.Drawing({
  margin: 5,
  pageHeight: 210,
  pageWidth: 297,
  frame: 'Grid', // SKYCAD.Layout | 'Grid' | 'Minimal' | 'None'
})
Notice that
framecould be a predefined one (i.e.Grid,MinimalorNone), or a custom one if you send your own layout.
However a drawing itself requires:
- pages to be shown through
drawing.addPage(). - content/layout in pages to be shown through
drawing.addContent().
addPage()
A drawing requires pages, which are used to add the content (as layouts). A drawing with 3 different pages would be like:
drawing.addPage(1) // margin and page size follow the drawing defaults.
drawing.addPage(2, { margin: 10 }) // overrides drawing's margin defaults (i.e. 5).
drawing.addPage(3, { pageHeight: 297, pageWidth: 420 }) // overrides drawing's page size (i.e. 210 and 297).
Optional arguments, that are not defined, take the value of the drawing's as default.
Below we have listed the most common page sizes:
const pageSizes = [
  { format: 'A4', pageWidth: 297, pageHeight: 210 },
  { format: 'A3', pageWidth: 420, pageHeight: 297 },
  { format: 'A2', pageWidth: 594, pageHeight: 420 },
  { format: 'A1', pageWidth: 841, pageHeight: 594 },
]
addContent()
The content of a drawing is nothing more than a layout. In order to add a layout in a drawing, drawing.addContent()
has to be used indicating in which page you want to add this layout. Therefore a page needs to exist (i.e.
drawing.addPage() needs to be used before). These are the most common examples of use:
- By using position & scale:
positionsets the real position of the layout in the page.scalechanges the scale of the layout when added to the drawing.showScaleshows the label of the scale (e.g.1:10) below the layout.textSizesets the size of all text presented in the layout, regardless ofscale
drawing.addContent(pageNr1, myLayout, {
  position: new SKYMATH.Vector2D(0.1 * pageWidth, 0.2 * pageHeight),
  scale: 0.1,
  showScale: true,
  textSize: 3,
}) - By using position & align:
positionsets the real position of the layout in the page.alignaligns the layout based on the position (ifpositionis used).
drawing.addContent(pageNr1, myLayout, {
  position: new SKYMATH.Vector2D(0.1 * pageWidth, 0.2 * pageHeight),
  align: {
    horizontal: 'center', // can be: 'left', 'center' or 'right'
    vertical: 'center', // can be: 'top', 'center' or 'bottom'
    ignoreAnnotations: false, // ignores text and dimensions in layouts for positioning
  },
}) - By using only align (typically for tables on corners)
alignaligns the layout based on the drawing page.
drawing.addContent(pageNr1, myLayout, {
  align: {
    horizontal: 'right', // can be: 'left', 'center' or 'right'
    vertical: 'top', // can be: 'top', 'center' or 'bottom'
  },
}) - By using autoscaling within bounds:
fitInsideautofits a layout within given real drawing-bounds and a list of scales.alignsets the layout position according to the bounds (iffitInsideis used).scaleandscaleLabelare given accordingly (iffitInsideis used).textSizesets the size of all text presented in the layout, regardless ofscale
const { scale, scaleLabel } = drawing.addContent(1, layout, {
  fitInside: {
    bounds: new SKYCAD.Bounds2D(new SKYMATH.Vector2D(10, 10), new SKYMATH.Vector2D(0.60 * pageWidth, pageHeight - 10)),
    validScales: [1/10, 1/20, 1/30, ...]
  },
  align: {
    horizontal: 'center',
    vertical: 'center',
    ignoreAnnotations: true,
  },
  textSize,
})
You can give a custom list of scales in
validScales. Otherwise, if it is undefined it takes the values according of the ISO standard of scales. See thatscaleandscaleLabelcan be used for further use (e.g. adding more content withscaleor even usescaleLabelfor the header later).When using
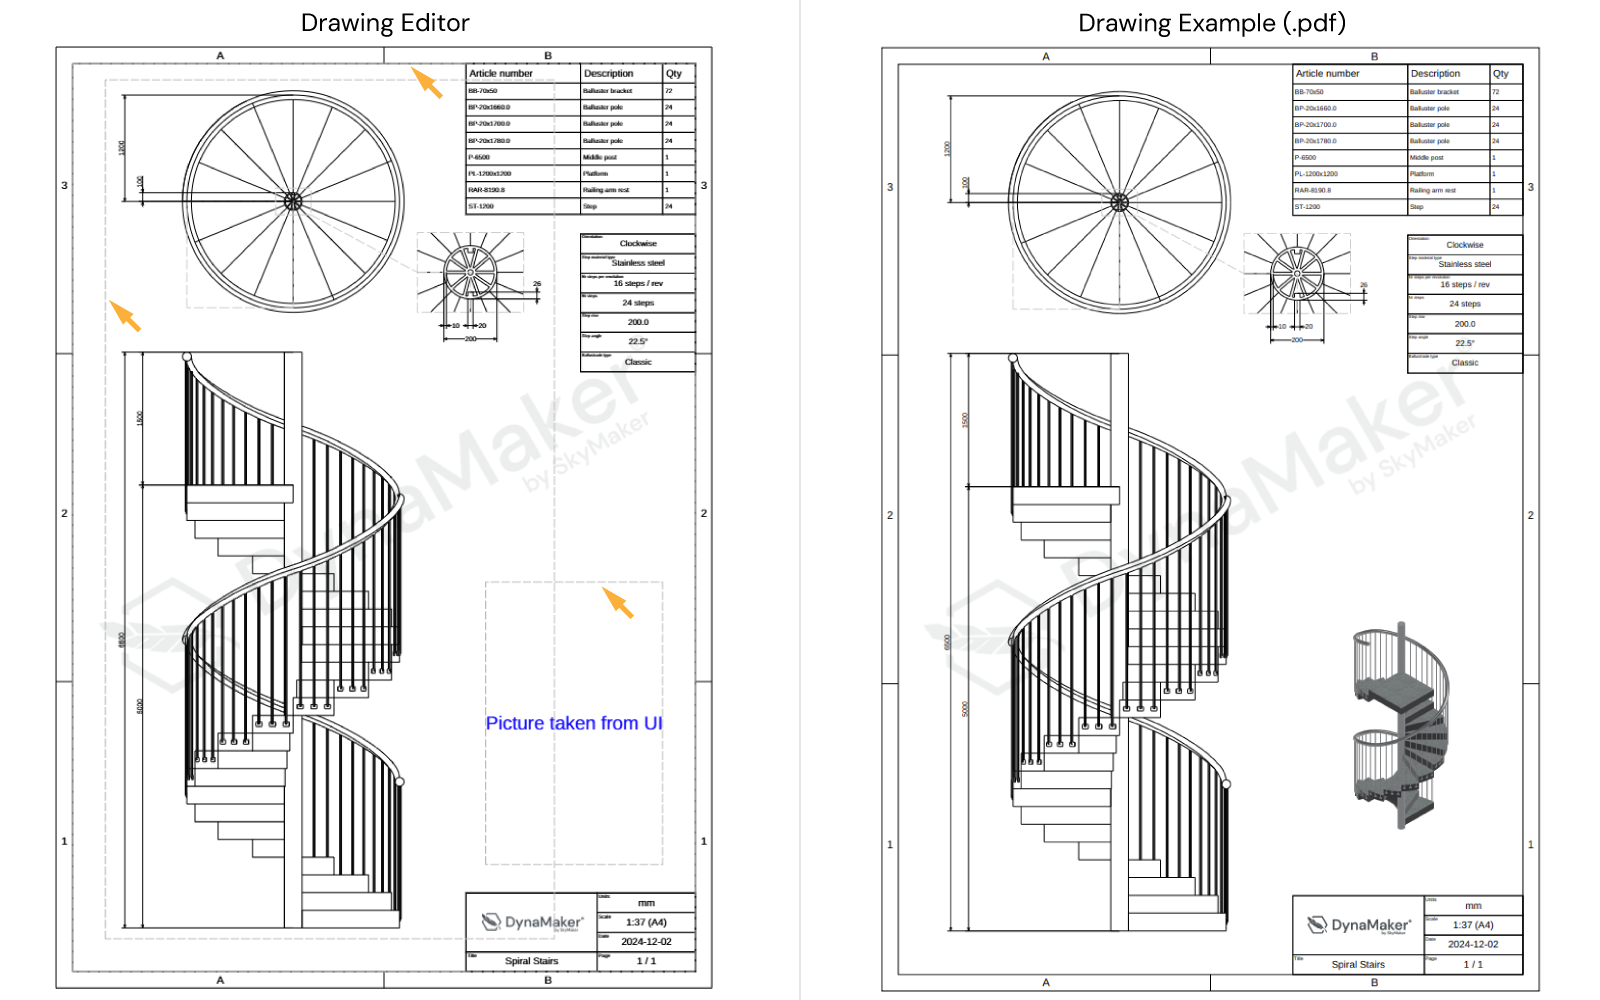
fitInside, notice that these bounds show up as a dashed-grey rectangle in the editor (highlighted with orange arrows in picture below for in this case: watermark, all views, and picture taken from UI respectively), providing you with a better visual feedback of possible overlapping bounds or even with layouts with dynamic content like the pictures taken from UI.
Header
A header is presented as a table converted into a layout. Create a simple version of it as:
const dateString = new Date().toISOString().split('T')[0]! // simplified date
const headerLayout = SKYDRAWING.generateSimpleHeader({
  date: dateString,
  pageNr: '1 of 1',
  projectId: 'Project Docs',
  quotationId: 'Q14-0198',
  scale: '1 : 20',
  width: 30,
})
This simple version is a layout already, so all the functionalities of the layouts can be used here, such as
headerLayout.scaleContent(0.75)and others.
However, you might want to create your own table. To do so, create a header as a table first and then convert it into a layout. As an example wrapped in a function:
function getHeaderLayout() {
  const dateString = new Date().toISOString().split('T')[0]! // simplified date
  const table = new SKYCAD.Table({ defaultTextSize: 3 })
  table.addText('1 : 1', 0, 0, { label: 'Scale' })
  table.addText('My coaster', 1, 0, { label: 'Project id' })
  table.addText(dateString, 2, 0, { label: 'Date' })
  table.addText('1 of 1', 3, 0, { label: 'Page' })
  const headerLayout = table.generateLayout()
  return headerLayout
}
Add Header To Page
drawing.setHeader(1, headerLayout, { anchor: 'bottom-right' })
drawing.setHeader(2, headerLayout, { anchor: 'top-right' })
Only one header can be added to a page. If more tables (ex. BOM or manufacturing lists) are to be added, these should be done through
drawing.addContent()instead.
Example
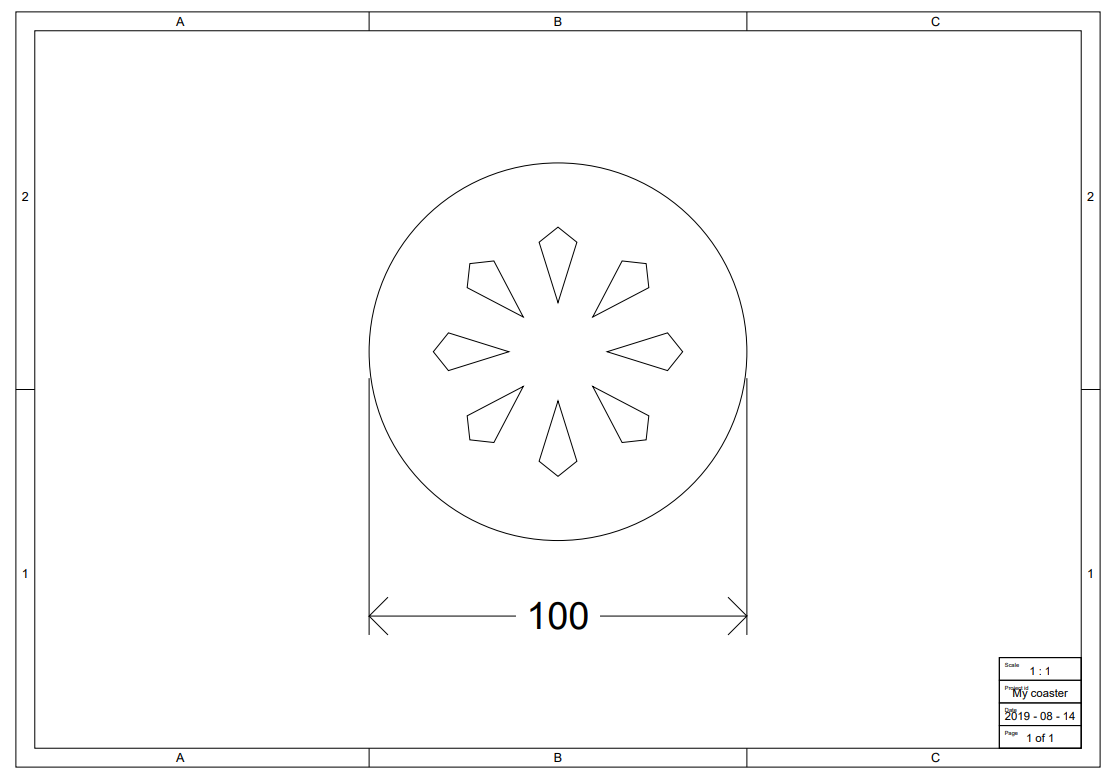
Below a simple example of a coaster using a circular pattern is presented:

function generateDrawing(component) {
  const drawing = new SKYDRAWING.Drawing()

  // Page
  const firstPage = 1
  drawing.addPage(firstPage, { pageHeight: 210, pageWidth: 297, frame: 'Grid' }) // A4 size

  // Content
  const layout = component.getLayoutForDrawing()
  const dimensionLayout = component.getSketch()
  layout.addLayout(dimensionLayout)
  drawing.addContent(firstPage, layout, { scale: 1, anchor: 'center' })

  // Header
  const dateString = new Date().toISOString().split('T')[0]! // simplified date
  const headerLayout = SKYDRAWING.generateSimpleHeader({
    date: dateString,
    pageNr: '1 of 1',
    projectId: 'My coaster',
    scale: '1 : 1',
  })
  headerLayout.scaleContent(0.5)
  drawing.setHeader(firstPage, headerLayout, { anchor: 'bottom-right' })

  return drawing
}
Export
The drawing can be exported as either PDF or DXF, but the raw data can be extracted directly from the function
generateDrawing() used in the DrawingMaker (DRAWING). For example, if the drawing is meant to be used and
downloaded in the app, then the drawing could be easily extracted by exporting the component COASTERDRAWING into the
app and use the function like:
const drawing = COASTERDRAWING.generateDrawing()
If you want to download the PDF or DXF files, you can check this section
